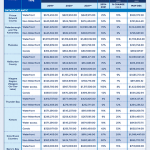
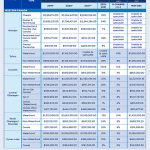
Download Western Canada average price report that includes Tofino & Whistler | Download Ontario-Atlantic report
Regional Market Highlights
Western Canada
A majority of Western Canada’s recreational markets are sellers’ markets, including Whistler, Shuswap, Canmore, Tofino, Ucluelet, Central Okanagan and Interlake Region of Manitoba. Most regions are seeing multiple offer scenarios, driving prices up for most property types. Out-of-province buyers – typically from Ontario – are looking to Canmore in pursuit of recreation and achieve greater work-life balance. With work-from-home conditions, demand has spiked and prices of non-waterfront properties in Canmore have increased by 26 per cent since 2019. Out-of-province buyers from the Lower Mainland and Vancouver Island are eyeing Tofino and Ucluelet, as well as out-of-country buyers from California. Both are looking to the region for the desire to relocate from urban centres and for a secondary residence.
With low inventory in Manitoba’s Interlake Region, prices of waterfront properties have increased by 43 per cent since 2019. Most activity is driven by buyers from within the province, typically families, millennial couples or investors looking for an affordable option outside of urban centres. With most buyers working from home in the region, good Wi-Fi access has become a top priority.
Ontario
All of Ontario’s recreational markets are sellers’ markets, with low inventory and high demand. These regions include Bancroft, Barrie-Innisfil, Haliburton, Kenora, Muskoka, Niagara region, Parry Sound, Peterborough and The Kawarthas, Prince Edward County, Sudbury and Thunder Bay to name a few.
Young families, many from the GTA and Hamilton, are now looking to Muskoka after feeling priced out of urban centres. This is impacting supply and affordability in the region, with average sale price of waterfront properties in Muskoka anticipated to increase by 20 per cent this year. Prince Edward County is seeing an uptick in buyers with work-from-home allowances, as well as retirees, who are considered to be driving the most market activity in the region.
In Niagara region, the average sale price of waterfront properties reached $1,546,561 in the first four months of 2021, a 77-per-cent increase from an average sale price of $875,036 in 2019. Strong price growth since 2019 was also evident in Niagara’s water-access properties, which increased 160 per cent, from $506,700 in 2019 to $1,317,500 in 2021. Continued price growth for these property types is anticipated through the remainder of the year, by nine per cent and eight per cent, respectively. Families looking for a secondary residence are the key drivers of market activity in the region. Strong interest from this cohort is anticipated to continue, with Niagara’s close proximity to Crystal Beach, Port Colborne, Niagara Falls and Grimsby.
Atlantic Canada
In Atlantic Canada, recreational property markets are experiencing similar conditions as local residential markets and other recreational markets nation-wide, with low inventory and high demand putting upward pressure on prices.
Charlottetown is a sellers’ market, with sales being driven by out-of-province buyers. A local RE/MAX broker reports that the region has become more attractive thanks to the province’s positioning as one of the safer communities in Canada, based on the number of COVID-19 cases and hospitalizations. This has put pressure on the region’s inventory, which was already struggling to meet demand. In 2021, recreational property prices in Charlottetown are anticipated to increase by five per cent for waterfront properties and seven per cent for non-waterfront properties.
The Halifax region is also experiencing sellers’ market conditions, with low inventory and high demand. Market activity is being driven by out-of-province buyers, with increased interest resulting from the pandemic and strict lockdown measures in other parts of Canada, along with increased flexibility to work remotely. The average sale price of waterfront properties in Halifax is $698,104, a 53-per-cent increase from 2019 ($456,515). In 2021, the average sale price of waterfront properties is projected to increase by seven per cent.
New Brunswick is also experiencing sellers’ market condition. For example, recreational property sales in St. Andrews are being driven by out-of-province buyers, thanks to the region’s lower average sale price compared to large urban centres. Low inventory is putting an upward pressure on waterfront properties, average sale price saw an increase of 132 per cent since 2019, rising from $320,000 to $741,650. The average sale price of waterfront properties is anticipated to increase by five per cent over the remainder of the year.
“In today’s real estate landscape, with increased demand and ongoing supply issues putting pressure on prices and sparking bidding wars, industry professionalism is of utmost importance,” says Elton Ash, Regional Executive Vice President, RE/MAX of Western Canada. “Recreational markets across Canada are feeling the pressure, and without a solution to address supply issues, we are running out of affordable options for Canadians.”
Unsurprisingly, affordability remains the top buying criteria for 41 per cent of Canadians who are in the market for a recreational property, followed by proximity to water or waterfront, amenities and good Wi-Fi. With demand for recreational properties anticipated to remain strong for the remainder of the year, lifestyle factors typically found in city homes, such as restaurants, Internet connection and office space are expected to remain a priority among buyers.
About the 2021 RE/MAX Recreational Property Report
The 2021 RE/MAX Recreational Property Report includes data and insights from RE/MAX brokerages. RE/MAX brokers and agents are surveyed on market activity and local developments. Average sale price prediction range is reflective of all property types in a region and varies depending on the region. Regional summaries with additional broker insights can be found at RE/MAX.ca.
Past RE/MAX Recreational Property Reports:
2019 Recreational Property Report
2018 Recreational Property Report
If you are looking for a recreational property, we can help!
CONTACT A REALTOR® | SEARCH FEATURED PROPERTIES
If you require specific information on property values call (250) 744-3301.
Original source: RE/MAX

